


Let’s face it, we all find statistics a little bit on the boring side. However, add a few simple graphics and hey presto the boring suddenly becomes something of interest and often allows us to see the wood from the trees. If you are like me and ‘mathematically challenge’ then infographics represent the perfect way in which to understand statistics.
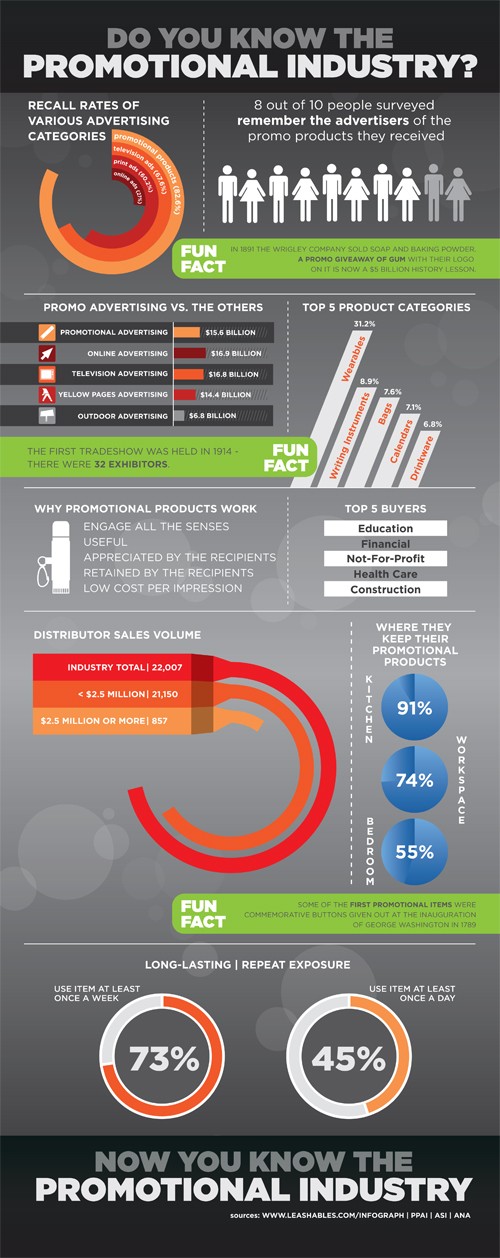
I recently came across this great infographic about the promotional products industry and I thought that I would share this with you. Some of the information even surprised me and I hope that you find it useful.
If you require further information or have any specific questions, don’t hesitate to give a member of our experienced team a call on 0800 0148 970 or simply email us today.