


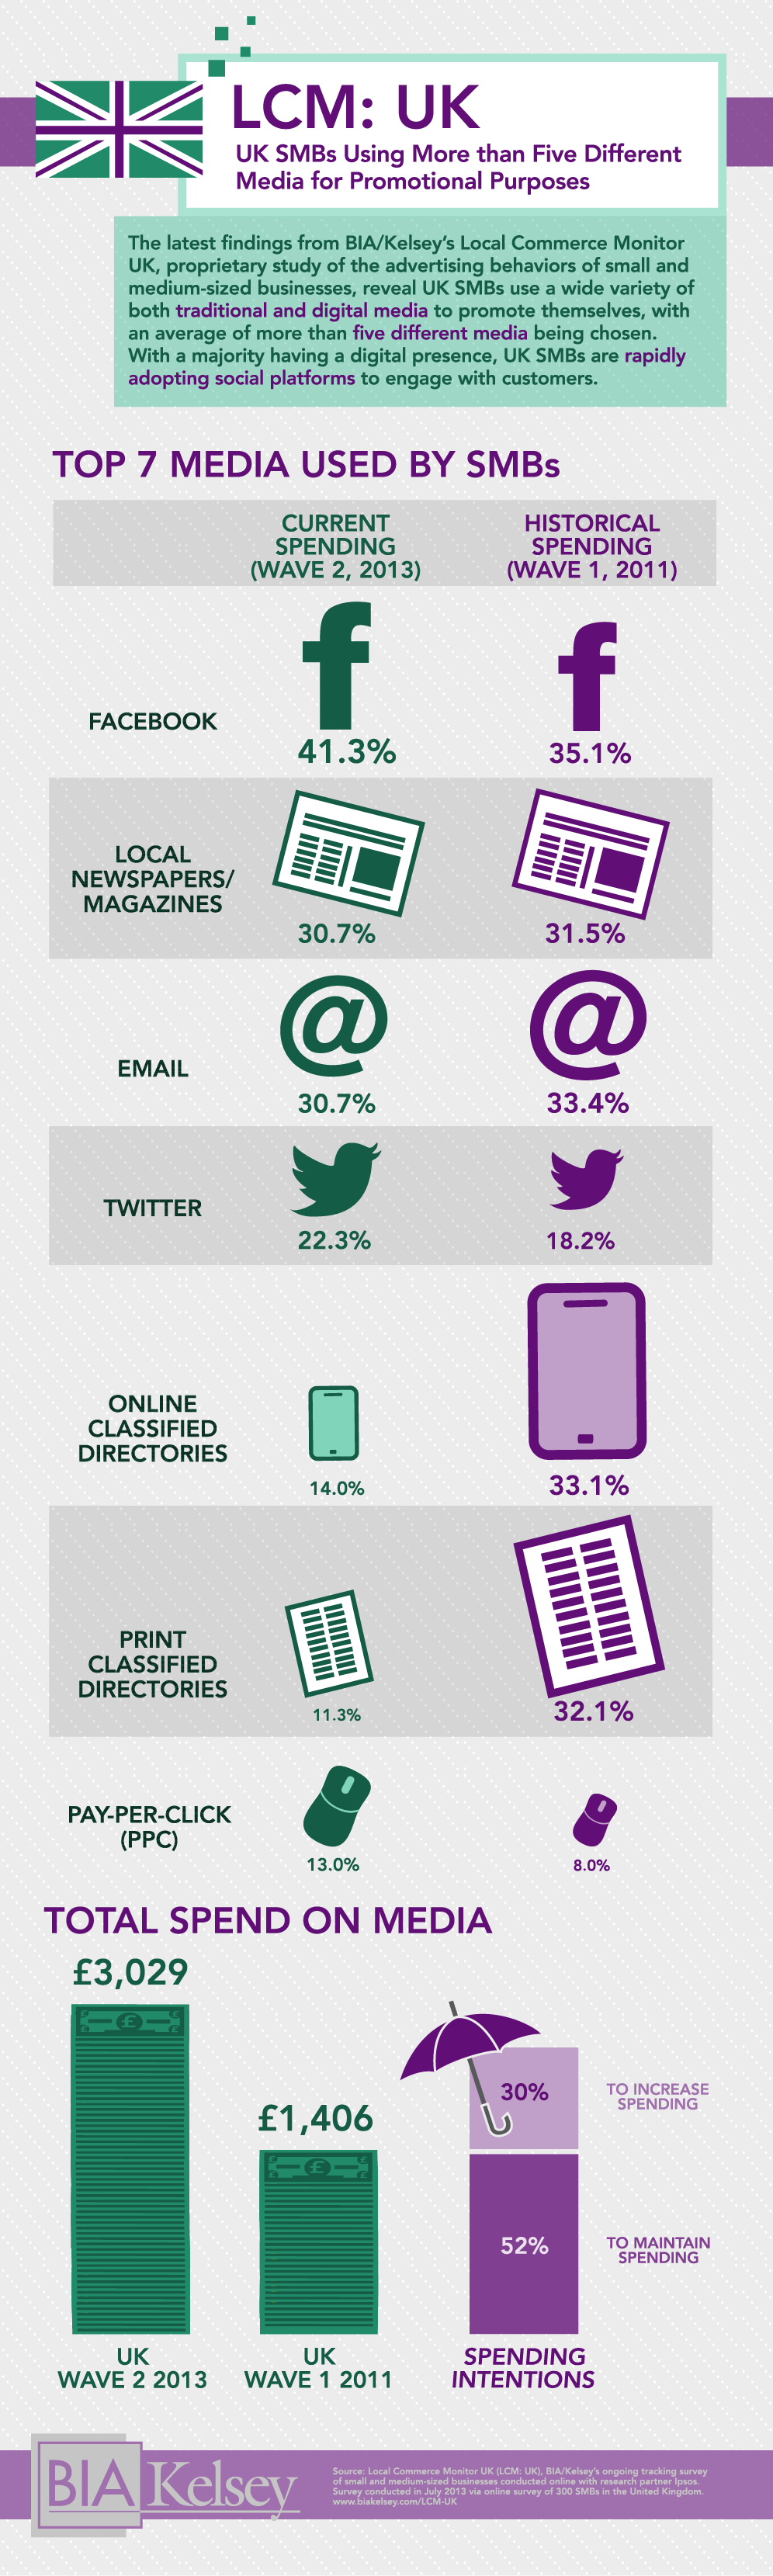
Small businesses in the UK have shifted their top media outlets. The infographic we are sharing today shows how small businesses in the UK use media including what the current spend is and where historical spending was. The full infographic can be found here. We split up the sections for easier visualisations with the data.
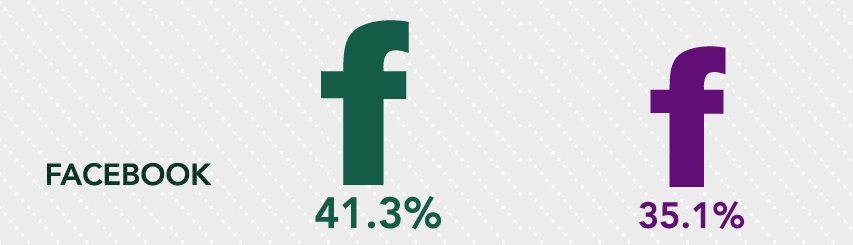
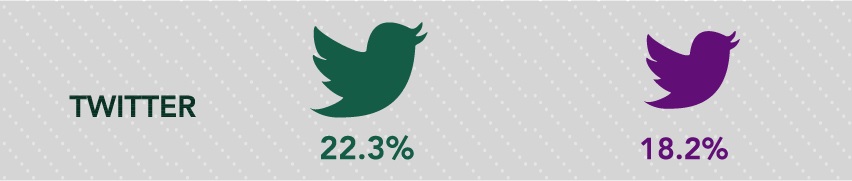
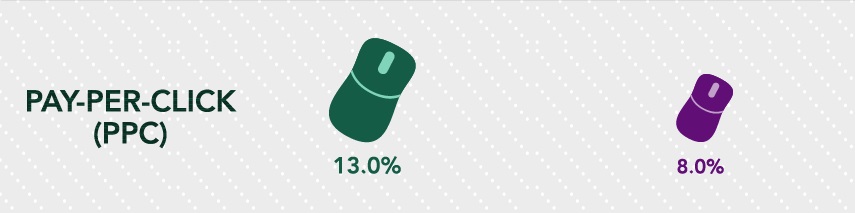
As you can see from the graphic, digital spending, specifically Facebook, Twitter, and pay per click campaigns have made significant increases. The biggest increase in spending was reported in Facebook advertising, which climbed to 41.3% in 2013 from 35.1% back in 2011.
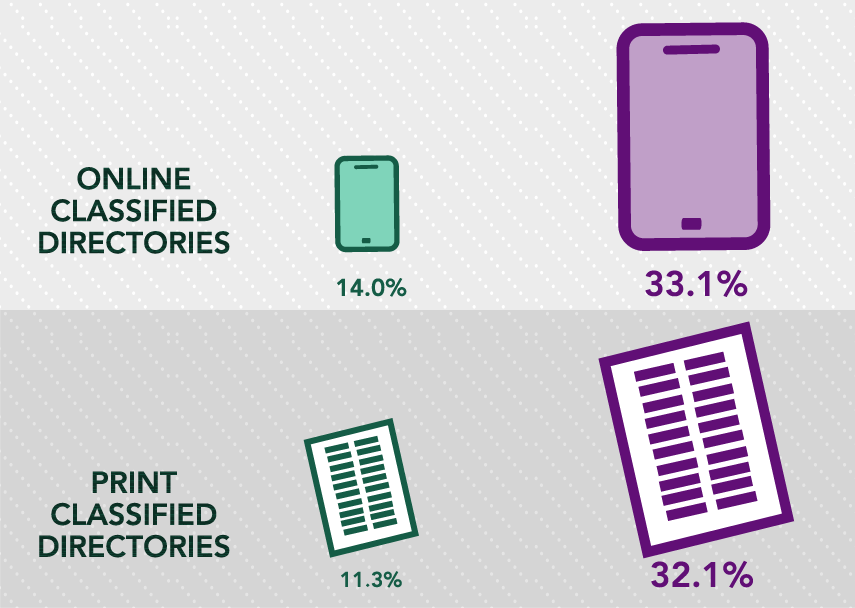
Not surprisingly, both print and online classified directories spending have decreased drastically; especially print which declined from 32.1% in 2011 to 11.3% in 2013.
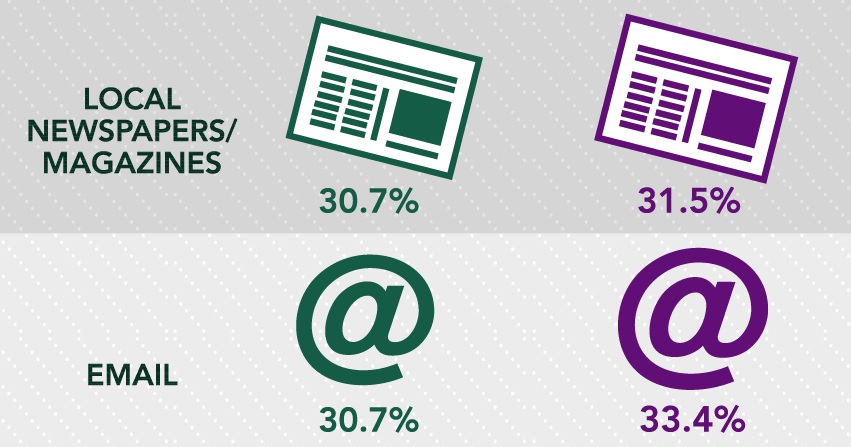
Newspaper and magazine spending decreased, but only by less than 1%. Email marketing spend also decrease by a small amount, less than 3%.
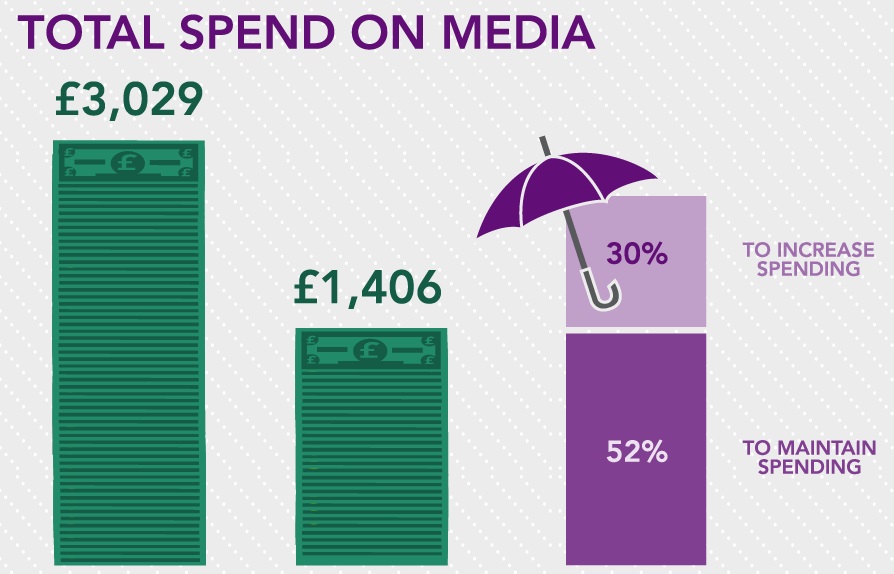
Total spend on media overall has increased in the UK. It was £1,406 in 2011 and more than doubled just two years later to £3,029 in 2013. As far as spending intentions gauged in 2013, 52% of small businesses in the UK plan on maintaining spend and 30% of UK small businesses plan to increase spending on advertising.
How does this line up with your business’ spending plans? Do these figures show you that maybe you should try something new in your advertising mix?
If you require further information or have any specific questions, don’t hesitate to give a member of the GoPromotional team a call on 0800 0148 970 or simply email us today.