As reports come in for the beginnings of the holiday season’s retail sales, we examine what early sales mean for the last minute push for Christmas shopping. Even though the infamous. Black Friday shopping day stems from the U.S. Thanksgiving holiday, the related sales have migrated overseas to the UK and other countries. Many international retailers are seeing an even larger boost in sales for Thanksgiving Day, traditionally a closed holiday in The States. Here are sales figures in an infographic from GoDataFeed:
Did you know what started all the craziness and sales on the day after Thanksgiving? Originally retailers were burdened with so many last minute shoppers, they started offering great deals to entice buyers to shop early right at the start of the holiday season after Thanksgiving, which is the 3rd Thursday in November each year. Their plan definitely worked! Online shopping has become a huge part of the shopping extravaganza. As ecommerce continues to grow, it is also a way for wary shoppers to avoid the craziness often associated with in store sales and crowds on Black Friday. At the same time, online shoppers can stay at home with friends and family while still taking advantage of deals and specials and no one has to run out right after their Thanksgiving meal or wake up ridiculously early either. According to GoDataFeed.com, online shoppers spent close to $11 billion from Thanksgiving Day to Cyber Monday. Of course, this shows that there is a growing trend for online shopping which seems to have been preferred over braving in-store shopping. A great deal of cyber shopping took place during a time known for brick-and-mortar sales.
Thanksgiving Day Sales Figures
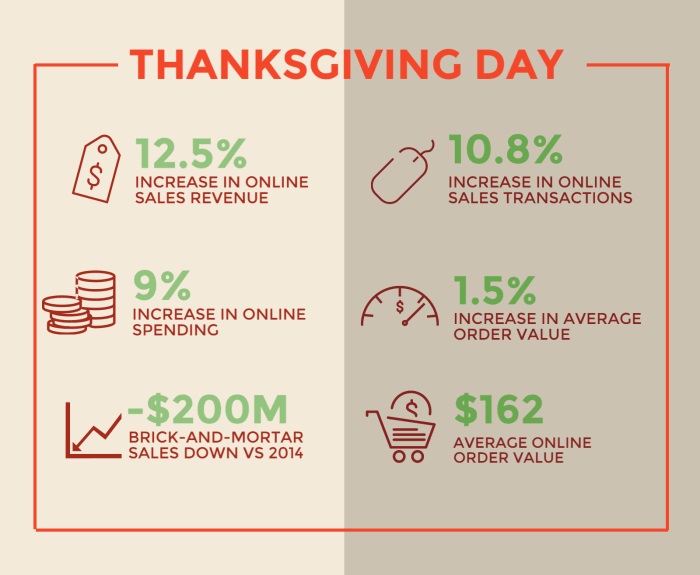
Thanksgiving Day 2015 saw a 12.5% increase in online sales revenue and a 10.8% increase in online sales transactions. There was a 9% increase in online spending and a 1.5% increase in average order value. The average online order value was $162. The important number here is brick-and-mortar sales were down -$200 million vs. 2014.
Black Friday Sales Figures
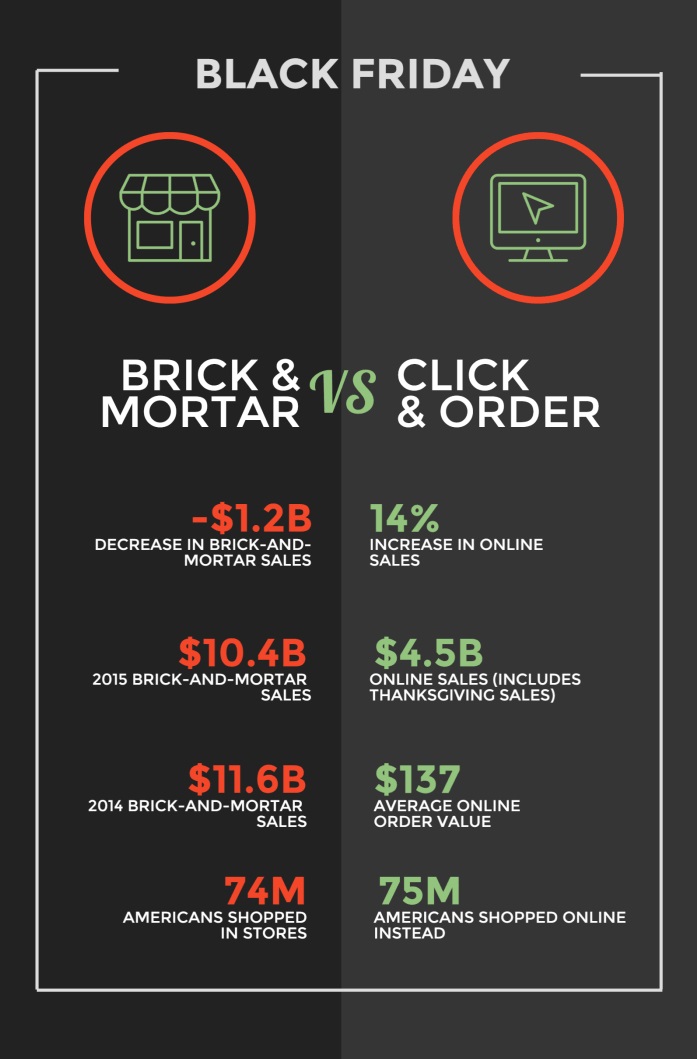
For Black Friday, the infographic shows the big trend for online sales vs. brick-and-mortar sales in the U.S. Brick-and-mortar sales saw a decrease of -$1.2 Billion while online sales reported a 14% increase. However, online sales totals still lagged behind brick-and-mortar sales with online sales for Thanksgiving and Black Friday totaling $4.5 Billion and Brick-and-Mortar Sales topped out at $10.4 Billion. That total is still down from 2014 by over $1 Billion in store sales. The average online order value was $137. More Americans shopped online than in stores with a total of 74 million Americans shopping in stores and 75 million Americans shopping online. Of course, the larger number of online sales could account for some consumers who shopping both in store and online. The infographic doesn’t address this possible duality.
Cyber Monday
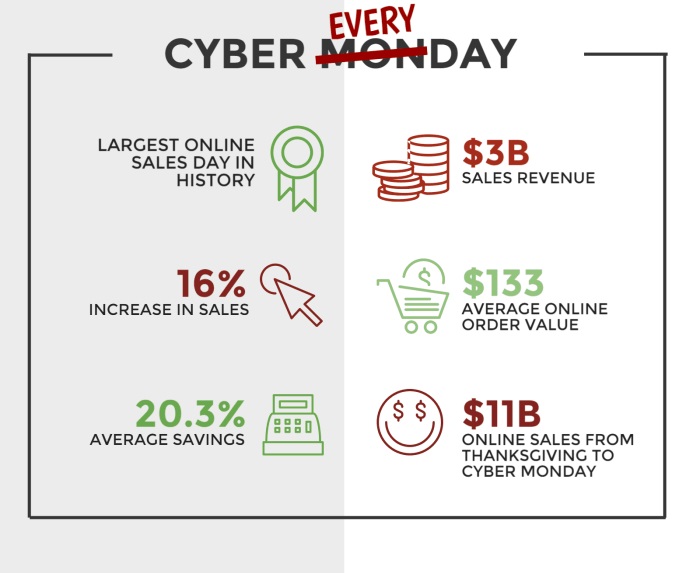
As indicated, it’s no longer just Cyber Monday, but “Cyber Everyday”. Also, Cyber Monday was established during a period of time when ecommerce sales where almost always greater during weekdays 9 to 5. Yet, Cyber Monday still eclipsed weekend sales with Cyber Monday reaching a landmark largest online sales day in history with $3 Billion in sales revenue for the day. This was a 16% increase in sales with an average online order value of $133. The average consumer saved an average of 20.3%. Online sales from Thanksgiving to Cyber Monday totaled $11 Billion.
See the full infographic below or online at GoDataFeed.com


